how to make your site analysis architecture map look 3d in illustrator


In this post I want to show you how I take one base plan and turn it into four different site analysis maps, each one answering a different question. Most site analysis maps fail because every element is fighting for attention, so this tutorial focuses on the one decision that fixes that more than any other: color.
where to get free site data
There are tons of options for getting your site data, so I won't bore you with all of them. I'll just tell you what I actually use: Rayon Maps. It's free, you don't need to sign up, and it gives you something most other tools won't, which is a full site analysis with separate layers already organized for you.
Open Rayon Maps, go to your site and draw a rectangle around the area you want to map. Here's a small tip that will save you a lot of pain later: keep your main site as close to the middle of the rectangle as possible. This matters a lot when you start composing and styling your image. Rayon Maps shows you how the map will look, gives you some extra info and asks for confirmation. A few seconds later you have your map, and you can open it directly in Rayon Design or export it as a CAD file.
Below the map you'll find site metrics like area, number of buildings, built footprint and green coverage, and two map options: Feature Breakdown and Program Breakdown. As always, double-check this against the info you have of the project, but these are the two maps we most commonly create when doing site analysis, so having them almost ready is a huge timesaver.
import into illustrator and do the dirty work
I import the DXF into Illustrator and select original size. If you want to adjust the scale of the paper, change the unit to centimeters or inches.
Now comes the most important but most underrated part of any site analysis, the work nobody wants to do: cleaning up your file. Looking at the map layer by layer, the water layer isn't closed, there's a road surfaces layer that isn't useful and is better deleted, and the road layers are just a bunch of lines, with no fills or regions that separate the roads from the background. I won't go through every single fix, but know this: no file looks perfect from the start. 99% of the time you have to clean up. This step alone already makes your map look more intentional than most site maps out there.
the secret to good maps: color choice
Color is the most satisfying step, but if you don't choose your colors well, it can also fall apart really fast. I'd go even further: I think the real secret to a good-looking site map is the color choice, not the detail or the line work. Because I'm creating several maps from the same file, I need a palette that makes all of them feel like they belong to the same series without looking identical. Paste your palette into your Illustrator file and use the eyedropper to pull the colors into each layer and object.
I start by turning off some layers, like the nature layer. Then I add a background layer in a grayish off-white, make the main streets (which I drew separately) completely white, and select all the buildings and change their fill to dark gray with no stroke.
add depth with a building shadow trick
Here's a small trick I always use with buildings. Duplicate the building layer: hold Alt and drag the layer down to create a copy. Move the copy down and a bit to the left with the arrow keys, then darken the fill of the duplicated layer. Now it looks like the buildings are casting shadows. It's a tiny detail, but it makes a huge difference when you want to add some depth to your site plan.
give the water depth with offset path
For the water, I use another trick that makes it look much more layered and technical than a flat blue shape. First, change the color to a muted pale blue. Then, with the shape selected, go to Object > Path > Offset Path and create an inner offset, something like -20 or -30. With the new shape selected, go to the Color window and drag the color picker down and to the right diagonally. This makes the color darker and more saturated while keeping it within the same tone. Repeat this at least two or three more times.
Now the water doesn't look like a flat surface. It feels like it has depth, like there's something to actually look at. This is one of those tricks that takes 30 seconds and makes the whole map look so much better. I also make sure my main building is a darker gray than the rest, and I manually draw a shadow layer for it, so it really stands out and it's obvious that this is the site.
clean text and labels
To finish this style, I create a layer called text, draw a dark gray rounded rectangle and place some white text on top. I name my main site and group everything together, then copy this label to other important places like parks, train stations and public buildings. And now we have our first site analysis map. It didn't take that long, but compared to what we started with, the difference is huge. You can see it in Image 1 below.

map 2: figure ground (nolli map) in three steps
I save the first map as a separate file, just in case, and move on to the next one, which takes three really simple steps:
- Change the main building to red. I like to use a red that isn't too bright, but well saturated.
- Change the rest of the buildings to dark gray. Not black, dark gray. There's a huge difference between the two.
- Turn off the shadows.
And voilà, we have our figure ground analysis map, or Nolli map, whichever way you prefer to call it. You can see it in Image 2 below.

map 3: vegetation and texture
You probably need to show more things, like vegetation and program, and that's what the next two maps do. For map three, I change the buildings to white, add a black stroke around them and turn the vegetation layer back on. This is where I want to add some texture and depth, because a flat layer of green is one of the things that makes site maps feel kind of cheap.
First I select all the vegetation and change it to a more saturated, colorful green. But a single tone of green doesn't represent what's actually on the site. If you open the location in Google Earth, you can see it isn't uniformly green at all. So we start varying the green. I change the train tracks to a grayish green, because they're obviously not green, and darken the public park to another green. The important thing is to stay within the same hue and just adjust the saturation and brightness, like the diagonal line we used for the water. I alternate between three greens depending on each area's use, scale or character. Then I turn on the tree layer, select all the trees and shift their hue so they sit nicely within the rest of the green areas. Image 3 below shows the result.

map 4: program breakdown with swatch libraries
To add the program data to the map, here's a small trick that saves a lot of time. Go to the Layers panel options in the top right corner and make sure Paste Remembers Layers is on. Then go to your program file, select all the layers and press Ctrl+C. Back in the base file, press Ctrl+V and choose to create new color swatches and apply to all. Now all the program layers are inside the main file.
To color them, I use a tool nobody really talks about: Illustrator's built-in color libraries. Go to Window > Swatch Libraries > Landscape and pick a palette. Click on the office layer and choose the first color, then the commercial layer and the next color, and so on until all your layers are colored. Finally, I change the stroke of the building layer to a darker reddish brown. You can see the final program map in Image 4 below.

And there you have it: four site analysis maps from one base file. The thing I want you to take away is this: most site maps don't work, not because they're missing detail, but because every element in them is fighting for attention. A good site map decides what you should look at first, and the way you make that decision is mostly through color.
the same workflow in rayon design
Everything I showed you in Illustrator can also be done inside Rayon Design, and in some ways it's even faster. Go back to Rayon Maps, but this time, instead of exporting to CAD, select Open in Rayon. You can create a Rayon account for free, and when the file opens, you can modify the fill colors directly: the buildings, the water and the background.
The big advantage is that you can create sheets that are ready to print or present. Once your site maps are ready, go to your canvases, create a new paper canvas and a page, and use Create View from Import to frame your main map. Next to it, draw three smaller circles, select them, click Convert to View and define the view for each one. Adjust the scale and framing, then go to the Rayon block library, search for a title block and drop it into your drawing. Edit the project info, the name and the scale, add extra text, swap in your logo and add a north symbol, and you have a site plan that's ready to present and export, like the one in Image 5 below.
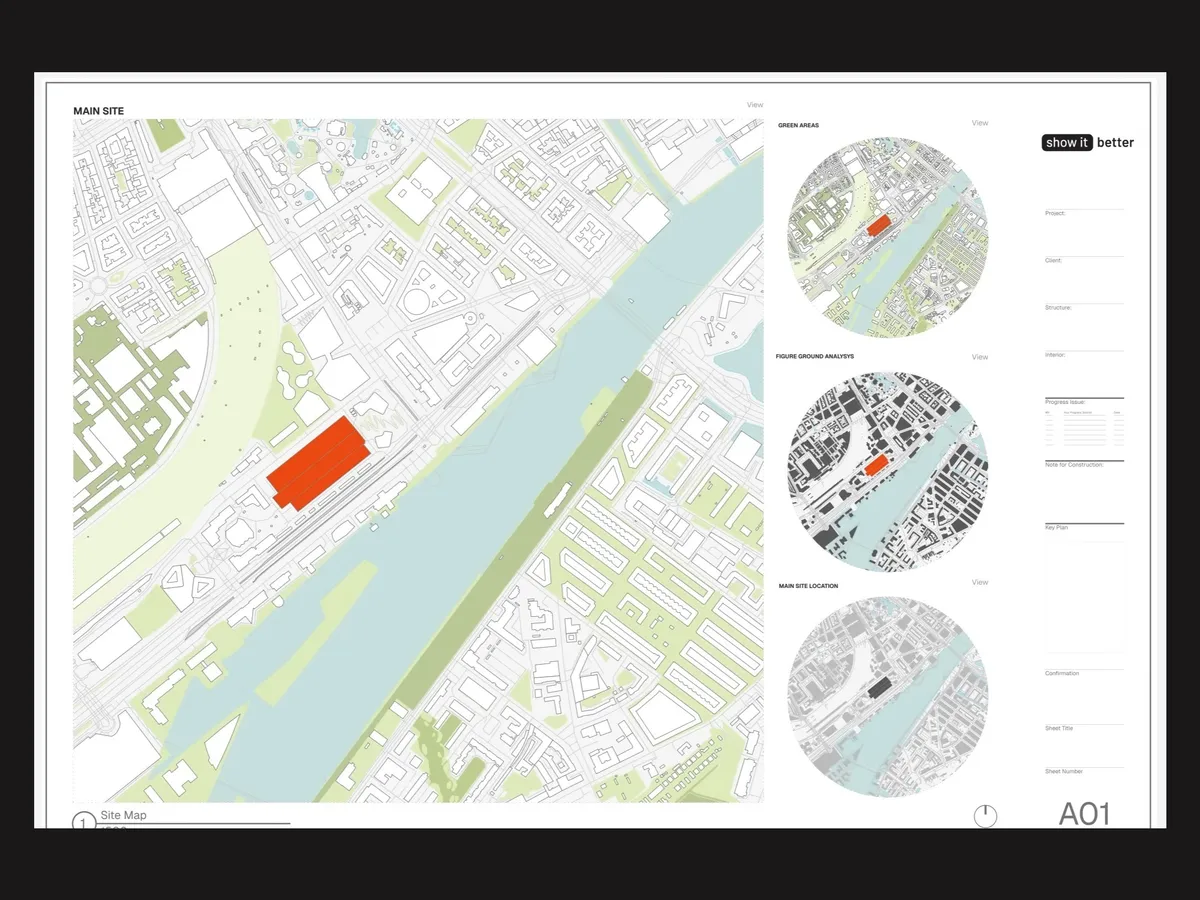
Thanks to Rayon for sponsoring this part of the video. You can sign up for Rayon for free here. Out of the four maps, which style did you like the most, and what other site analysis tutorials would you like to see? Let me know in the comments on the video. And if you want to see how I apply this same thinking to floor plans, check out my video on drawing the same floor plan in three levels of complexity.


